Tracing
Tracing is one of the pillards of Observability. It is analogous to stack trace of a program, but in the distributed world of (micro)services.
First, it started as seperate efforts of various entites, nowadays it is standardized under the Open Telemetry initiative (a part of CNCF).
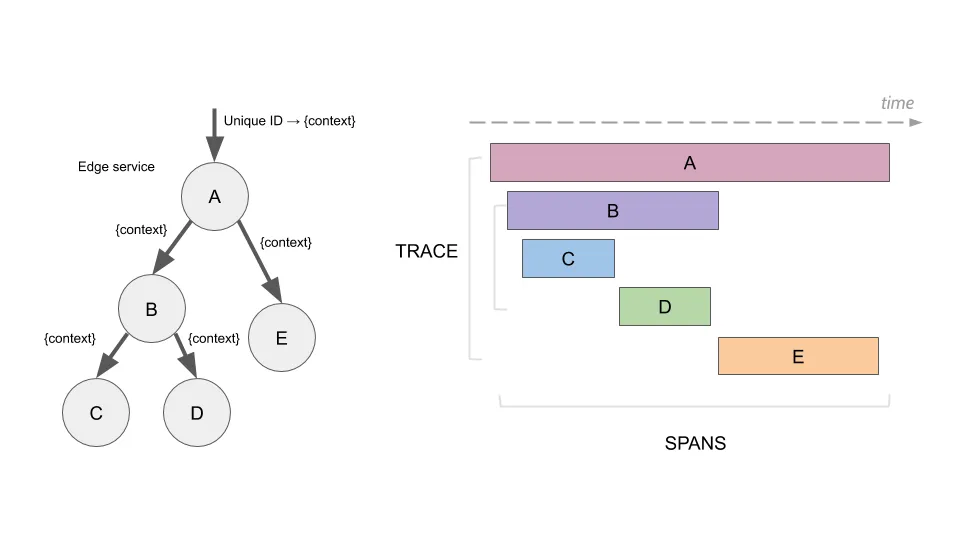
A trace is a collection of spans - time-bound operations that are part of some scenario. Most often these are network calls, but they can also represent other things. We could actually represent a “traditional” call stack of a single process with spans of a trace. Although possible, it’s not the recommended approach. It is alright though to include the most important parts of a single process (especially the ones that take majority of time of a trace) in a trace.
Here’s an illustration that represents tracing, found in the Jaeger Docs
Architecture
Most often, the general tracing setup looks like this:
The SDK and Collector are a part of OpenTelemetry. The UI needs to be something that conforms to the OpenTelemetry standard, e.g. Jaeger. The choice of teh database is dictated by both the Collector and UI, since both theses entities will access the database.
The architecture could differ, some new actors could be added (like agents), or removed (e.g., Jaeger could be run with in-memory database).
Here’s how it could look like with Agent added:
The purpose of having an Agent is to relax the burden of network communication between the App and the Collector. The communication with the Collector could be slow. The communication between the App and the Agent should be fast (Agent could be a side-car of our App).
Other than that, the Agent is actually the same app as Collector. It has a bunch of configuration that could be useful for us (explained down below).
SDK
Looking at a single app, the SDK works in a pipeline, like this:
Instrumentation
Instrumentation is the origin of every span. We can create spans manually, or automatically via auto-instrumentation. Auto-instrumentation is specific to various protocols/frameworks. E.g., we could install auto-instrumentation for Express or Nest.js, and it will automatically create spans for every incoming request. Many frameworks have some accompanying auto-instrumentation (often various versions for the same framework).
Spans may have some additional metadata attached. These are Resources. We can add some data to every span, enriching them. Examples include:
- git commit ID of the running process
- container ID of the running process
There are also additional apckages called Detectors. They are able to
automatically attach some environment-specific data to our Resources. Examples
could include Azure Detector or AWS Detector. These would automatically include
some cloud-specific data to our spans. Similarly, git Detector would attach
commit ID (if .git directory is part of the deployment). A detector could also
discover the name of our service (e.g., based on package.json).
All the setup of tracing is wrapped in a provied - e.g. NodeProvider for
Node.js apps.
Custom Intrumentation
The SDK allows us to implement custom intrumentations. That may come useful when some framework or library does not have any available instrumentations. Auto-intrumentation helps in keeping the code clean of tracing logic. Manual instrumentation on the other hand, “pollutes” the code with non-business logic.
Processors
Processors sit between the instrumentation and exporters. Most often, they are used for batching. Out-of-the-box, the following processors are available:
- SimpleProcessor - just relays every single span to the Exporter
- BatchProcessor - batches spans and relays these batches to the Exporter
- NoOpProcessor - drops every span, nothing will be sent
- MultipleProcessor - allows to compose multiple processors in a single pipeline
Propagation
In some cases, it is difficult to attach tracing metadata in the messaging with
other services. WebSockets could be an example of such messaging. WebSockets do
not support any way of sending metadata, like headers in HTTP. Because of that,
data like traceId needs to be sent as part of application message. The SDK
comes with a propagator that can both inject and extract that metadata from the
messages. Both the sender and the receiver need to be aware of this metadata
being there.
Another example could be Redis - it also does not support metadata.
Formats
There are a bunch of formats of tracing that have emerged since tracing was
born. The one used by default by the OpenTelemetry SDK is the W3C Trace
Context. In short, it includes tracing
information (like trace ID) in an HTTP header called traceparent.
There are also other standards, like Jaeger and B3. These are considered legacy, and shouldn’t be used by new projects. However, there are cases where we want to integrate with older systems that still use the proprietary format. The OpenTelemetry SDK supports us with that via propagators. By default, the W3C propagator is used. A propagator basically does two things:
- extracts tracing metadata from the incoming communication (like an HTTP request)
- injects tracing metadata into the messages going out
A propagator really needs to implement just these 2 methods, and it can be used in tracing initialization.
Traces
Traces are composed of spans. Spans are composed of:
- timestamps (start and end)
- origin service
- events - things that happened during the span, but do not deserve their own separate span. Potentially, that could be due to the fact that they do not have start-end timestamps.
- attributes - key-value pairs of meta-data (similar to Resources, but we can attach them ad-hoc, isntead of predefining for all spans)
- errors - if an exception occurs during the span, the error message could be added.
- traceId - each span belongs to some trace.
An important concept is how traceId is being shared among services. There always is some root service where the journey starts. That service generates the traceId. Any call to other services will include that traceId. This way, when these downstream services record their spans, they will attach the traceId that they received.
Traces are being sent by all the services to the collector (could be via Agents, but it doens’t matter in this context). Interestingly, a root service (or any other service in the chain) may decide not to trace (e.g. due to sampling configuration). That decision may be transmitted to the “child” services. If these services are properly configured, they will respect the upstream decision, and will not trace the traffic.
Collector
The collector works very similarly to the SDK in an app. It has a pipeline:
There could be many receivers, processors, and exporters. Instead of initializing the pipeline in code (like we do with the SDK), we do it in YAML.
Processors include things like Sampling.
Sampling
One of the most important things to configure in a Collector is Sampling. In bigger systems, the amount of traces that we collect could have significant impact on the costs and performance.
In general, the following samping strategies should be applied:
- 100% sampling - when we don’t have a lot of traffic in the systems, it might be alright to just log everything
- 20-50% - debugging issues - this amount of traces should be enough to debug some system-wide issue
- 5-10% - typical setup - it should be enough for general monitoring of the system. If something fails, we’ll record 10% of failures
- 5% - understanding the system architecture
The sampling may be configured with more details, like logging 10% of traces uncless there’s an error - then, we’d always log it.
Sampling can be done on two levels:
- app (SDK) - head-sampling - apps decide what to send
- collector - tail-sampling - apps send everything
Some mix of the two could also be utilized.
The difference between the two is about the point in time when the decision to sample is being made.
Head-Sampling
In head-sampling, when the root service decides not to trace some request, it will ask downstream services not to trace as well. If, during that journey, some error occurs, trafific will not be traced (unlesss some child service is configured otherwise, but it will not help us with missing spans from the parent that did not want to trace).
Service that makes the sampling decision makes it before a potential issue occurs. It’s non-ideal.
Tail-Sampling
In tail-sampling, the collector has access to the whole trace and may decide whether it wants to store it or not. The decision can be made based on various factors:
- span(s) latency
- some attribute values (e.g. HTTP status codes)
- span(s) status codes (since traces can have errors attached)
- rate limiting (e.g. max 50/s)
- probabilistic (e.g. 50%)
Head vs tail sampling:
- when we only want to log errors - Tail
- when we want to log only traces with latency problems - Tail
- when we want to log only specific routes - Head
Tips
- In Node.js, tracing needs to be enabled before even importing any other non-tracing related dependencies!